Some of the things I mention may seem obvious to you, but based on my experience - some of these very obvious details can be some of the pitfalls that prevent many developers from debugging their applications once deployed to WebORB, so now I include them here in my list for the seasoned developers to ignore and the novices to use.
First make sure that your assemblies are compiled with DEBUG information, you don't have to deploy the PDB files to the WebORB BIN directory. PDB files are the program database files which holds debugging and project state information for your program, but Visual Studio and the .NET runtime can map the debug assembly to the code in Visual Studio if just the PDB files are available in the output directory of the Visual Studio project.
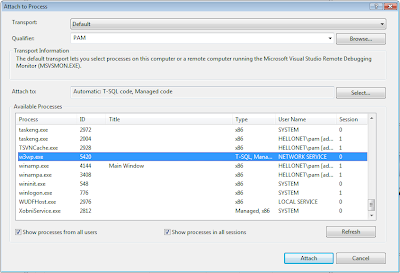
From Visual Studio (I am using 2008, but its the same for 2005) with the code open used to generate the assemblies, you open the "Attach to Process" window found from the "Debug" menu.

Make sure that the checkbox "Show processes in all sessions" is selected.
Find the w3wp.exe (The IIS Worker Process) and attach the debugger to it.
I have for the sake of convenience mapped the following keyboard shortcut for opening this window: CTRL+SHIFT+ALT+F5. That has enabled me to start the debugging process with the following key sequence:
* CTRL+SHIFT+ALT+F5
* "w" or "W"
* RETURN
Now Visual Studio will start the debugging session and map the debugging assembly to the code in Visual Studio.
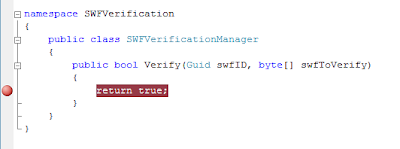
As the debugging information are loaded you will see your breakpoint indicators be filled out, effectively indicating that debugging information mapping to the current code have been loaded. If your breakpoint indicators remain unfilled circles, it is not working, a likely cause for this is that the deployed assemblies have been compiled without DEBUG information.

Once your assemblies are loaded correctly and your breakpoint indicators are correctly filled, you turn your attention to either your application or the WebORB management console (I recommend the latter as its always a good idea to test each tier isolated).
Once you execute the code which eventually will hit the breakpoints, control will be transferred to Visual Studio and your debugging session should be fully active.
PS. Yes, the code in the second screendumb is a joke :-)
No comments:
Post a Comment